
While we believe SciChart is pretty performant out of the box, you can do a few things to make CPU cycles go that extra bit further. With the following tips enabled it is possible to render many tens of millions of points at interactive framerates with SciChart.
Keep up-to-date with the Latest SciChart Version
We are always working on improving performance of the overall charting engine.
Staying up to date helps to ensure you have the latest algorithms and optimizations for fast, efficient charting with SciChart. For example, check out the insane performance improvements we made in SciChart WPF v6. Staying up to date ensures you can benefit from things like this.
Check your Computer’s Power Management Options
By default, the Balanced Power Plan in Windows (see Control Panel > Power Options) includes CPU throttling. This is designed to reduce power usage when the CPU is not being heavily loaded, or, is overheating.
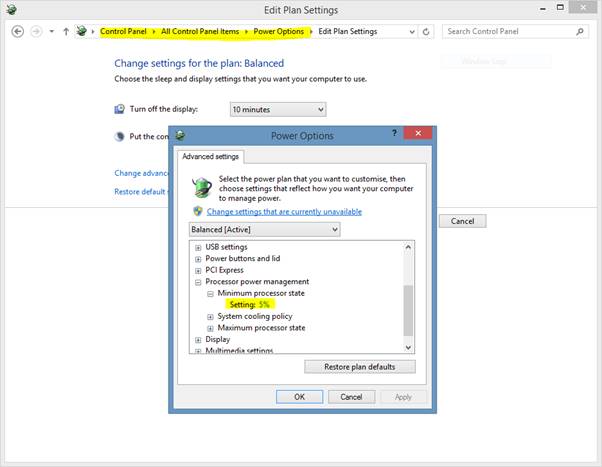
Because SciChart uses throttling and does not continually enage the CPU, this can trick the operating system into thinking it’s not very busy, causing the CPU to be throttled down e.g. run at a lower clock frequency or with higher latency. We have noticed considerable performance gains and resolution of stutter on some PC’s by disabling CPU throttling on the target OS.